
Every step benchmarked against top-quartile apps, so you find the leak costing you the most paying customers. Then you track the trend and compare periods to prove the lift.
Prys is the Shopify app growth platform for Shopify app developers.
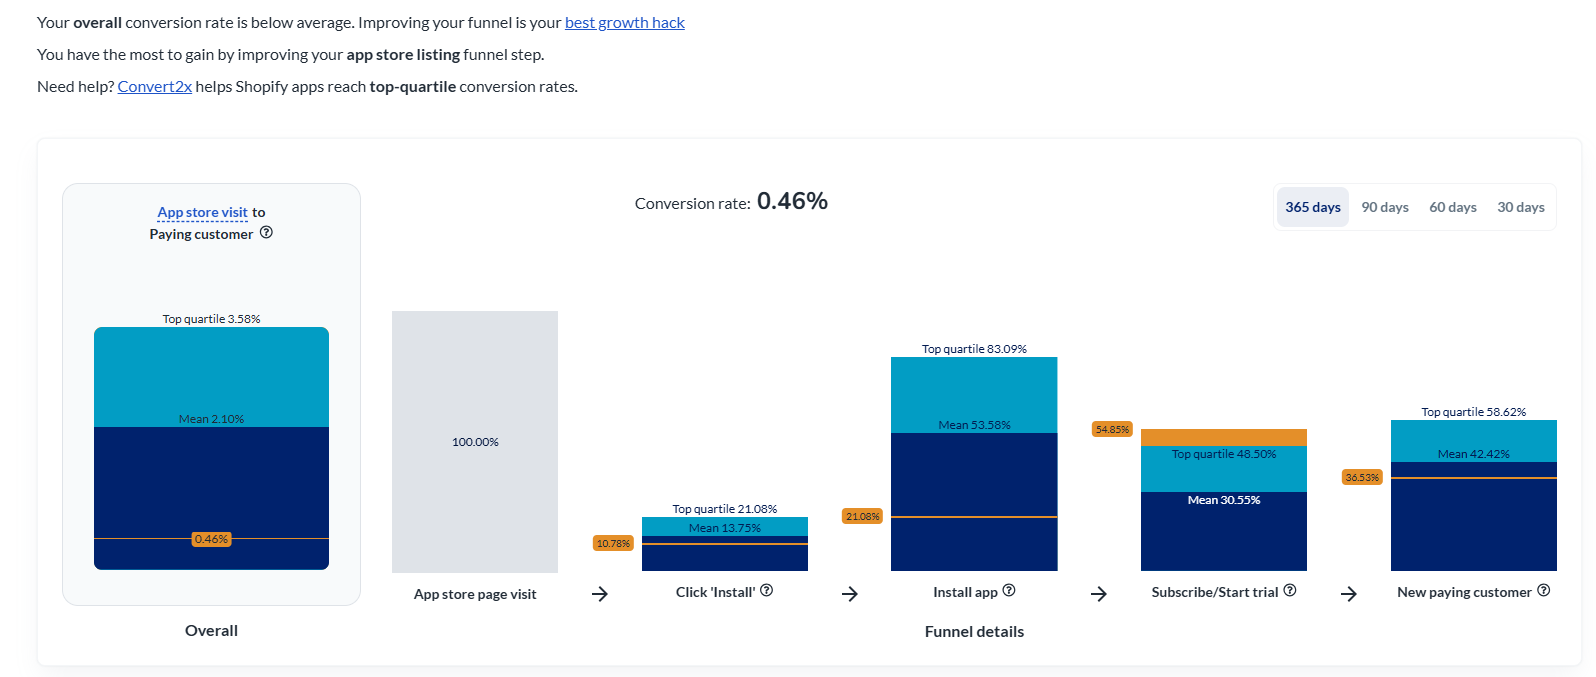
Every step is benchmarked against the mean and top quartile of apps in your niche, and tied to real paying customers, not just clicks. The step bleeding the most revenue stands out at a glance.
Watch each step over time. A slow decline shows up before it costs you, and a change you shipped shows up as a real move in the line.
Turn on period comparison and read the delta before and after a change on the same trend line, so you know it worked.
Your Shopify app conversion funnel is the path a merchant takes from your app store page to a paying customer: they visit your listing, click Install, install the app, subscribe or start a trial, and become a paying customer. To get there they have to clear every step. Most Shopify apps convert under 1% of app store visitors into paying customers, so a gain at any step compounds into a lot of revenue.
From app store visit to paying customer, three conversions decide your funnel, and they are where Shopify apps leak the most. Because a funnel multiplies, the step furthest below its benchmark is the one costing you the most paying customers. For each one you see your rate against the mean and top quartile of apps in your niche, the trend over time, and a period comparison to prove a change worked.
Visit to install click. Whether a visitor clicks Install is decided by your app store listing: the app name and the keywords in it, the subtitle, the icon, the first screenshot, and your reviews. This is both your Shopify app store SEO & AEO and your first conversion step. Prys benchmarks your visit-to-install-click rate against your niche, charts the trend, and compares periods after a listing change. Full playbook: Shopify app store listing optimization.
Install to subscribe. After install, the goal is getting merchants to subscribe as fast as possible: send them to the subscription screen, or through your pricing page at most, and keep onboarding to a few steps with smart defaults and fast time to value. This is usually where the most paying customers leak. Prys benchmarks your install-to-subscribe rate, tracks the trend, and compares periods so you can see whether a shorter flow moved it. More in Shopify app conversion rate optimization.
Subscribe to paying customer. Once the trial starts, the merchant is yours to lose. Getting them to your core value in the first few minutes, breaking the trial into milestones, and nudging before it ends is what turns a subscriber into a paying customer. Prys benchmarks your subscribe-to-paying rate, charts the trend, and compares periods. More on improving your Shopify app conversion rate.
Benchmarking every step is what surfaces the leak. On your own you can see your own numbers but not the market, so you cannot tell a weak step from a normal one. Prys shows each stage against the mean and top quartile of apps in your niche, with the benchmark bar filling navy from zero to average and teal from average to top quartile, and your rate marked on it. The steps furthest below benchmark are your leaks, and the ones worth fixing first.
Once the benchmark shows which step leaks, the fix is usually a known pattern. Top-quartile app store pages lead with a concrete result in the first screenshot and put the strongest keyword in the subtitle. Top onboarding flows show value before asking for payment and keep required setup to a few fields. Prys shows how far below benchmark each step runs, so you know which pattern to apply first.
The average app converts 2.12% of app store visitors into paying customers, and the top quartile converts 3.41%. On install, the average visit-to-install rate is 19.34% and install-to-subscribe is 29.89%. Prys shows where you land on each and lets you set the niche you compare against.
The proof is in a period comparison. Turn on the comparison and Prys shades the window before and after your change on the same trend line, with the delta, so you can see whether install-to-subscribe or visit-to-paying actually moved, instead of guessing from a noisy chart.
The average app converts 2.12% of app store visitors into paying customers, and the top quartile converts 3.41%.
Prys benchmarks each funnel step against the mean and top quartile of apps in your niche, so the steps furthest below benchmark stand out.
Turn on period comparison and Prys shades the window before and after your change on the same trend line and shows the delta, so you can see the lift.
The one with the most room to improve. Because a funnel multiplies, a gain in any step lifts the whole funnel equally.
Benchmark every step against top apps, see where you leak, and compare periods to prove the lift.